How to Actually Grow a Dating Business: Stop Building Features, Start Fixing Your Funnel

How to Launch a Dating App in 2026: Solving the Cold Start Problem
January 12, 2026Stop Guessing, Start Building: The Data-Driven Way to Scale Your Dating App
February 11, 2026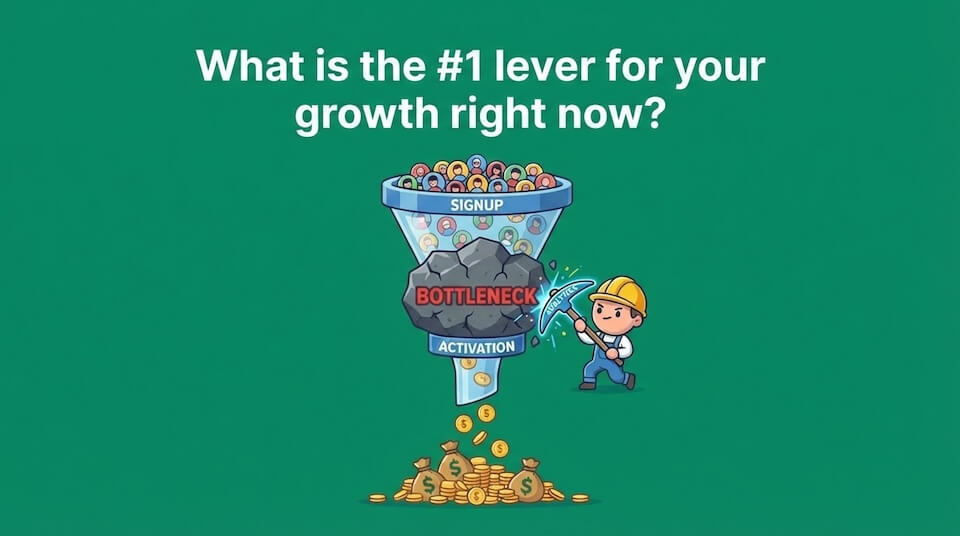
Serial entrepreneur with over 15 years of experience in the online dating industry. He has successfully built and scaled multiple platforms from zero to millions in revenue, including Meetville (Co-Founder, scaled to $5M+ ARR) and Seeking.com (Head of Growth, drove $20M+ in revenue growth).
Alex helps founders build profitable dating businesses, not just apps. He shares playbooks on launching and growing dating products.
You have successfully launched your dating app or site. It is live on the App Store and Google Play. You are seeing sign-ups, perhaps even generating some initial revenue. But then, you hit a wall.
The growth stops. Registrations plateau, revenue flattens, and you don’t have a massive budget to burn on paid acquisition. You feel stuck. The natural instinct for almost every founder in this situation is to “build more.” You tell yourself: “If I just add this one new feature—maybe a travel mode, or better swipe animations—the users will come, and the money will follow.”
You invest time and money. You ship the feature. And… nothing changes. The numbers stay exactly where they were.
This is what I call the “Build Trap.” This is a state where you measure success by the quantity of features released rather than the business problems solved. Even more dangerous is the “Blind Build Trap,” where you launch features without knowing if anyone even uses them.
The problem isn’t that you aren’t working hard enough. The problem is that you are trying to solve a strategy problem with code. To grow, you need to stop shipping random features and start fixing your funnel.
The Way Out: Goals Based on Unit Economics
To escape the trap, we must move away from generic wishes like “I want more users” and look at the math. As I have detailed in my article on The Unit Economics of Dating Apps, the formula for any dating business is:
Expected Income = (New Buyers × LTV) – Marketing Costs
This formula connects your product to your marketing:
-
New Buyers: The efficiency of your conversion funnels (turning a visitor into a payer).
-
LTV (Lifetime Value): How much you earn from one customer over their entire “life” in the app.
-
Marketing Costs: Your acquisition spend.
To influence this formula, we need to look at the user journey through two distinct lenses: Value (Retention) and Money (Monetization).
Lens 1: The Value Journey
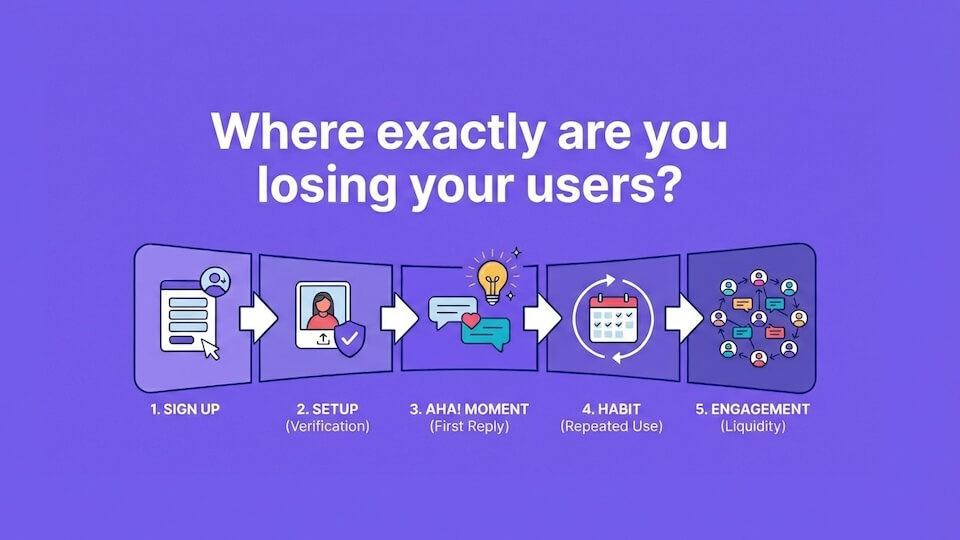
You cannot have a high Lifetime Value (LTV) if the user’s “life” in your app is short. To diagnose why users leave, I rely on the Reforge Engagement + Retention methodology. This framework helps us understand if we are successfully keeping the user by breaking the lifecycle into five distinct stages:
Sign up → Setup Moment → Aha Moment → Habit → Engagement
Let’s break them down, because most dating apps fail by mixing these up.
1. Sign up
The user has simply handed over their credentials. In the dating industry, this stage acts as a critical gatekeeper: you must verify that the user is 18+ years old to comply with legal regulations and often validate a phone number to filter out bots and spammers. While these steps are mandatory for safety, they add significant friction before the user has seen a single profile. At this point, they are just a qualified database entry, not an active user.
To streamline this process, integrating Google and Apple SSO is essential, as it dramatically reduces typing and speeds up entry. For standard email signups, I strongly recommend using Email OTP (One-Time Password) flows instead of static passwords. While requiring the user to switch apps to fetch a code adds slight friction, it creates a passwordless environment. This effectively eliminates the risk of brute-force attacks, as there is no static password to steal or guess.
2. The Setup Moment
This is the “admission ticket.” The user performs the minimum necessary actions to make the product work. In a dating app, this means becoming discoverable.
-
Uploading a photo.
-
Filling out the profile bio.
-
Passing moderation.
- Setting search filters (who they want to see).Until this is done, the user cannot be shown to others. If they drop off here, they are not a “user” — they are a failed registration.
3. The Aha Moment (The Value)
This is the pivotal moment when the user suddenly realizes the core value of the product. It’s the instant when the lightbulb goes on and they think: “This is useful, I get why I should stay.”
To understand this better, look at the famous metrics from tech giants:
-
Facebook: Their Aha Moment wasn’t just logging in; it was getting “7 friends in 10 days.” Only then did the newsfeed become interesting enough to keep them coming back.
-
Uber: It’s not opening the map; it’s the moment the car actually arrives at your curb.
-
Slack: It’s not creating a channel; it’s when a team sends 2,000 messages. That’s the threshold where the history becomes searchable and valuable.
The Misconception in Dating: Many founders mistakenly believe that browsing profiles is the Aha Moment. It is not. Browsing is just “window shopping”—it’s passive and lonely.
The Reality: In a dating app, the product is not the software; the product is the connection. Therefore, the Aha Moment is Social Validation.
-
It is the first Match (proof that “I am desirable”).
-
It is the first Reply (proof that “These people are real”).
If a user swipes for 20 minutes (Work) and gets zero matches (No Reward), they haven’t experienced the value. They have only experienced rejection. If this happens in the first session, they are gone forever.
4. Habit
At this stage, the user has experienced the “Aha Moment” enough times that the application becomes part of their daily or weekly lifestyle. The goal here is to transition the user from External Triggers (push notifications, emails) to Internal Triggers (boredom, loneliness, or just a free moment during a commute).
In dating, a formed habit looks like the “Hook Model”: the user feels a moment of boredom, instinctively opens the app to see if they have new likes or messages (Variable Reward), and invests time by swiping (Investment). If you still have to bombard a user with “We miss you” emails after two weeks to get them to login, they have not formed a habit. Your retention strategy here shifts from “onboarding” to “frequency management,” ensuring there is always fresh content (new profiles) to satisfy the urge when they open the app.
5. Engagement
The user is now a “Power User.” But how do we define that? In product analytics, we measure Engagement along three specific dimensions: Frequency, Intensity, and Feature Depth.
-
Frequency: How often they return. In dating, a highly engaged user might open the app 10+ times a day just to check for new signals.
-
Intensity: How much time they spend per session. Are they just “snacking” (quick swipes) or are they spending 45 minutes in a deep conversation?
-
Feature Depth: This is the most critical metric for dating apps. It measures whether users are utilizing the advanced tools that build real emotional connections (like Voice Notes or Video Chat).
The Strategic Goal: Your ultimate task is to migrate as many users as possible from the casual “Habit” stage to this deep “Engagement” state. Power Users are your most valuable asset: they retain longer, monetize better, and create the most activity (likes/messages) for the ecosystem, driving the experience for everyone else.
The “Video Chat” Trap: A Case Study
Let’s see how adopting this framework shifts our focus from simply shipping features to solving user problems. Let’s apply this to a specific feature, like Video Chat.
The goal is not to “build a video chat feature.” The goal is to remove friction between the stages.
-
If users drop off at Setup: Building a cool “video chat” is useless — they aren’t even completing their profiles! You need to fix the onboarding flow.
-
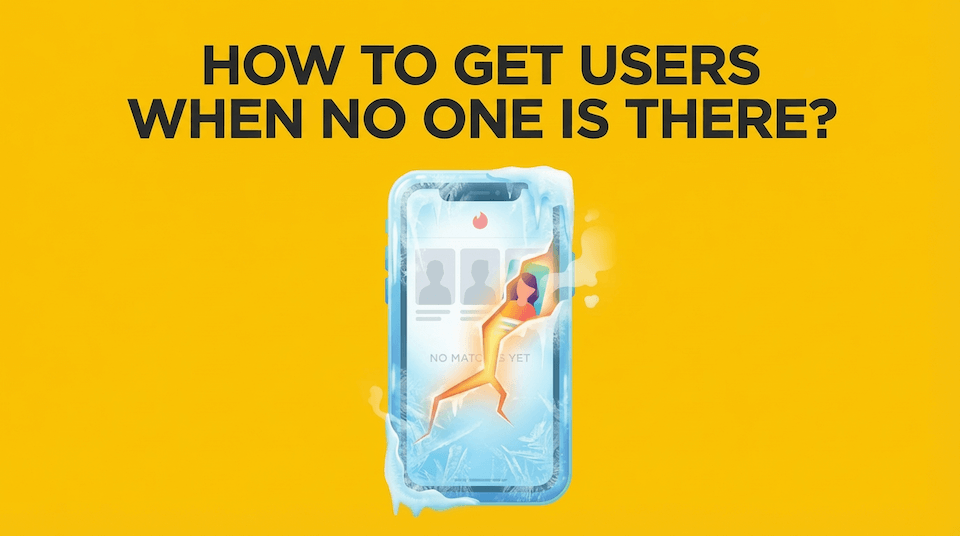
If users finish Setup but don’t reach Aha (no matches/replies): You need to fix the matching algorithm or user liquidity (get more people in their area), not change the color of the buttons.
-
If they reach Aha but don’t form a Habit: You need re-engagement mechanics (push notifications, digests).
-
But if users are Engaged but leaving the app to talk on WhatsApp: Then you build Video Chat — to keep that value inside your product (Engagement stage).
You stop guessing and start building specific paths to move the user from one stage to the next.
Lens 2: The Money Journey
Once you are retaining users, you need to monetize them. Many founders treat monetization as a single step: “Add a payment system.”
In reality, the Number of New Buyers is a structural funnel:
New Buyers = (Registrations × Paywall View Rate) × Purchase Conversion
This reveals two separate levers you must pull:
1. Paywall View Rate
This is simple: You cannot sell what people do not see.
-
Subscription Offers: Do users see the offer during onboarding? On every new session start?
-
Feature Unlocks: Consider the “See Who Liked You” feature. If you hide this deep in a menu, your Paywall View Rate is near zero.
-
The Fix: You must merchandise your features. If you show a blurred photo teaser on the main dashboard, add a red notification badge (“3 New Likes”), and trigger a popup when they tap it, your View Rate skyrockets.
2. Purchase Conversion
Of the people who actually saw the blurred photo teaser, how many clicked “Pay”?
-
If 100% of users see the teaser, but only 0.1% buy, you have a Value Proposition or Pricing problem.
-
If 5% see it, but 20% buy, you have a Visibility problem. You are hiding your best feature.
The Metrics Tree: Connecting Inputs to Outputs
This is the most critical tool for your strategy. A Metrics Tree prevents you from drowning in random data by organizing your metrics into a logical hierarchy of Outputs (Results) and Inputs (Levers).
You start at the top and drill down to find the root cause.
Level 1: The Output
At the very top is Net Revenue. This is your root metric, but it is a lagging indicator. You cannot impact it directly; it merely tells you what happened in the past. If you only stare at Revenue, you are driving by looking in the rearview mirror.
Level 2: The Drivers
To move Revenue, you break it down into its two core components:
-
Monetization Velocity: The volume of New Buyers (How well you convert demand).
-
Retention Strength: LTV & Churn (How much value users get).
Level 3: The Inputs
This is where the real work happens. These are leading indicators—specific user behaviors you can actually influence through product changes. Let’s decompose them fully.
A. Inputs to Improve “New Buyers”
To get more buyers, you don’t just “optimize the paywall.” You need to optimize the events that lead to the paywall.
- Onboarding Completion (Inventory Generation):If a user doesn’t upload a photo during onboarding, they won’t get any Likes. If they have 0 Likes, the “Who Liked Me” screen is empty. There is nothing to sell.
- Notification Deliverability (The Hook):Most Likes happen when the user is offline. You need to bring them back to pay. If your Push/Email Delivery Rate is low (or going to Spam), or your Open Rate is low (boring copy), the user never returns to the app to see the blurred photo.
- Teaser Visibility (In-App Awareness):Once they are in the app, do they see the teaser? Is there a “Red Dot” badge on the tab? Is the blurred photo visible on the main screen?
- Close Rate (The Offer):When they finally tap the blurred photo, how many actually pay? This tests your pricing and value proposition.
B. Inputs to Improve “LTV”
Why aren’t users retaining? usually, because they missed the “Aha Moment.” We need to look at Liquidity Metrics: Visit-to-Like Rate, Match Rate, and Reply Rate.
Let’s drill down into a low Reply Rate. If users match but don’t talk, they churn. Why is the Reply Rate low?
-
Notification Speed: Speed is critical in dating. If a push notification arrives 5 minutes late (or goes to spam), the “emotional moment” is lost, and the user might have already closed the app.
-
Opening Message Quality (The “Hi” Problem): Analyze the content. If 80% of first messages are just “Hey,” the Reply Rate will be naturally low. You might need to prompt users with icebreakers.
-
Profile Trust Signals: Does the sender look real? Users often ignore messages from profiles with only one photo or no bio, fearing bots or scammers.
-
Active Status: Was the message sent to a user who hasn’t logged in for 30 days? This is an inventory currency problem—you are showing inactive users, leading to ghosting.
Real-World Example: Troubleshooting a Revenue Drop
Imagine your overall revenue drops by 10%. You drill down and see the drop is coming specifically from the “See Who Likes You” paywall.
A novice product manager might say: “Let’s lower the price!” or “Let’s change the button color!”
But using the Metrics Tree, you look deeper at the Inputs:
-
Trace it down: Users are hitting the paywall, but the Close Rate has dropped.
-
Dig into Inventory: You discover that the average number of “Incoming Likes” per user has dropped. Instead of seeing “You have 10 new likes,” users now see “You have 1 new like.” The curiosity gap—the primary driver of this purchase—has collapsed.
-
Find the Root Cause: Why did likes drop? It wasn’t a pricing issue. It was a Feed Algorithm issue. The algorithm started showing users profiles they didn’t find attractive, so they started swiping left.
-
The Solution: Fix the feed relevance → Likes go up → “You have 10 likes” reappears → Paywall conversion recovers.
The Strategy: OMTM and The ICE Framework
Once you build this tree, you will spot problems everywhere. You cannot fix them all at once.
1. Select Your OMTM (One Metric That Matters)
Look for the “Constraint”—the step in the funnel with the biggest drop-off relative to benchmarks.
-
If your Setup Moment completion is low, ignore the paywall. Focus entirely on onboarding.
-
If your Signup-to-Match Rate is low, focus entirely on liquidity.
2. The Hypothesis Loop
Once the OMTM is set, switch to execution mode.
-
Generate Ideas: Brainstorm features specifically designed to move that one metric.
-
Prioritize (ICE Score): Score every idea on Impact, Confidence, and Ease. You can read more about how to use the ICE method here.
-
Execute: Run the winner as an A/B test. This means splitting your traffic to show the new version (Variant B) to one group of users while keeping the original version (Variant A) for the rest, allowing you to scientifically measure which one performs better. If you need a primer on how to design these experiments, check out this guide to A/B testing.
-
Ship or Kill: This is the most critical step. If the metric didn’t move, delete the code. Do not keep “zombie features” that add technical debt but no value.
Your Algorithm for Growth
If your dating app isn’t growing, stop shipping random features. Instead, follow this diagnostic loop:
-
Audit the Journey: Map out the exact path users take for Value (Sign-up → Setup → Aha → Habit → Engagement) and Money.
-
Build the Metrics Tree: Connect your bank account to specific user behaviors (Inputs).
-
Locate the Leak: Find the bottleneck where users are dropping off.
-
Pick Your OMTM: Focus 100% of your energy on that single metric for the next quarter.
-
Run the ICE Cycle: Brainstorm, Test, Analyze, and—crucially—Kill what doesn’t work.
Why This Strategy Fails Without Analytics
Everything discussed above—the Metrics Tree, the OMTM, the ICE framework—is impossible to execute on “gut feeling.”
You cannot fix a funnel if you cannot see it. Unless you can measure exactly what is happening inside your app, you are not managing a product; you are just believing in it.
To succeed, you must be able to answer these questions with hard data, not guesses:
-
What is the exact drop-off rate at the Setup Moment? (Are they failing to upload a photo?)
-
What is your Signup-to-Match Rate? (Is the product actually working?)
-
What is the View Rate of your “Who Likes Me” paywall? (Are users even seeing your offer?)
-
What percentage of users reach the Aha Moment (First meaningful reply)?
If you don’t have these numbers, your “strategy” is just hallucination.
The logical next step is implementing Product Analytics. Tools like Mixpanel, Amplitude, or PostHog allow you to see the real user path and manage through facts.
I am currently working on a detailed guide about setting up the right tracking plans and avoiding common data pitfalls. This article is coming soon, so stay tuned for updates on the blog.
